快速建立 Azure Alert 告警詳細說明
複製 MCB Monitor Portal 提供的 MCB Dashoard 圖表使用的查詢字串,搭配 ARM 執行範本 M-general-alert.json ,可以快速建立一般與嚴重等級 Azure Alert 告警功能,並自動傳遞告警訊息到 MCB Portal 事件中心 此功能僅支援 MCB 進階儀錶板
以下步驟前置作業流程
- 登入 MCB Portal > 監控 > 右上角 "更多監控資訊" 進入 MCB Monitor Portal
- 選擇 左下角 Preference,先確認目前所在的 Organizations 是正確的,Role 必須是Editor
- 回到左列功能表選擇 Dashboard,切換至您的 Dashboard,選擇如下的看板,此例為記憶體可用空間圖表,如下圖所示,切換進入 Edit 畫面
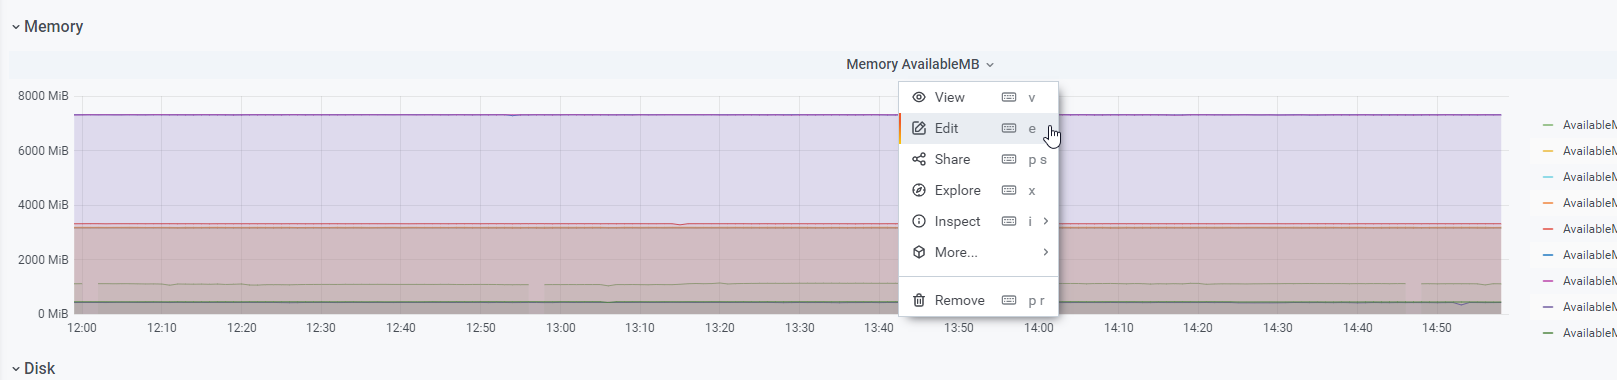
- 複製下圖查詢字串的內容

- 根據查詢字串 Kusto 語法,進行修正,什麼是 Kusto 可參考官方教學
- 刪除此行 >>
| where $__timeFilter(TimeGenerated) - 修改 summarize 後面的關鍵字為 AvailabledValue
修正前的查詢字串
InsightsMetrics
| where $__timeFilter(TimeGenerated)
| where Origin == "vm.azm.ms"
| where Namespace == "Memory"
| where Name == "AvailableMB"
| summarize AvailableMB= avg(Val) by Computer, bin(TimeGenerated, 1m)
| order by TimeGenerated asc
修正後的查詢字串
InsightsMetrics
| where Origin == "vm.azm.ms"
| where Namespace == "Memory"
| where Name == "AvailableMB"
| summarize AggregatedValue= avg(Val) by Computer, bin(TimeGenerated, 1m)
| order by TimeGenerated asc
- 找出依據哪個欄位進行加總 Aggregated Column,此例是 (by 之後的欄位) Computer
| summarize AggregatedValue= avg(Val) by Computer, bin(TimeGenerated, 1m)
- 若遇到有等號出現的例子,等號左邊是 Alais naming,例如下面的例子,加總的欄位 Aggregated Column 則是 VM
| summarize AggregatedValue= avg(Val) by VM = Computer, bin(TimeGenerated, 1m)
以下是快速建置 Azure Alert 流程說明
- 下載右側 ARM 執行範本 M-general-alert.json,請另存JSON檔

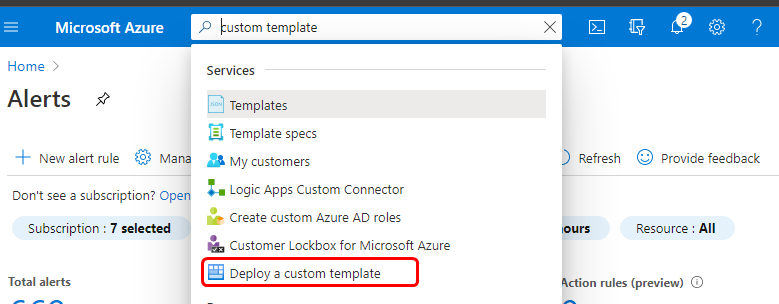
- 以 CSP 身分登入 Azure Portal,經由 My Customers 切換到客戶資源,在上方搜尋欄輸入 "custom template",找到 Deploy a custom template 功能,如下圖所示
- 出現 Custom deployment 功能頁,點選 Build your own template in the editor,出現 Edit template 功能,選擇上方 Load file,如下圖所示
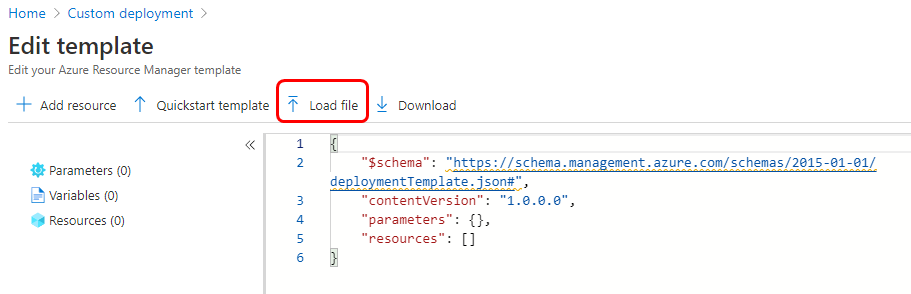
- 上傳步驟 1 準備好的 ARM 執行範本 M-general-alert.json,選擇 Save,進入待輸入供裝參數畫面
- 輸入供裝參數如下圖

- 按下 Review + Create 即進行部署
供裝參數說明
- Subscription: 為 log analytics workspace 所在的訂閱
- Resource Group: 為 log analytics workspace 所在的資源群組
- Alert Rule Name: 告警規則名稱
- Alert Rule Description: 告警規則描述說明
- Workspace Name: 您的 log analytics workspace 名稱
- Kusto Query String: 前述修正後的查詢字串
- Serverity Level: 1 代表嚴重告警,3 代表一般告警
- Query Type: ResultCount
- Aggregate Value Threshold Operator: 依據監測的值,選擇適當的條件判斷,例如此例是記憶體可用空間,應選擇 "小於(LessThan)"或 "小於等於(LessThanOrEqual)"
- Aggregate Value Threshold: 依據監測的值,輸入適當的值,例如此例是記憶體可用空間查詢結果的單位是 MB,可以填入 350,表示 350 MB
- Time Window In Minutes: 需要提取資料進行查詢的時間視窗(應大於或等於 Frequency In Minutes)(以分鐘表示)
- Frequency In Minutes: 定義運行搜索的頻率和時間間隔,應計算規則條件的頻率(以分鐘表示)
- Trigger Condition Operator: 條件觸發評估條件,此例選擇 "大於"
- Trigger Condition Threshold: 指標觸發器的閾值,此例輸入2,此處的整體條件意義為,當偵測記憶體可用空間小於或等於350 MB 時,在 10 分鐘的區間內,以五分鐘為一次的條件下,滿足大於兩次時,觸發告警
- Trigger Condition Alert Based On Type: 指標觸發類型 - "連續" 或 "總計"
- Aggregate On Column: 加總基於特定的欄位,此例是 Computer
- Suppress Alerts In Minutes: 冷卻告警時間(以分鐘表示),可連續條件到達時,頻繁的發送告警訊息,設為 0 時,則不啟用此功能